


VP of Strategy & People at Greenhouse
Articulating the return on investment (ROI) of People Practices is extremely challenging. Unlike other departments in the organization, the output of the People Team isn’t as directly tied to business outcomes and has few measurable outputs. Because of this, it’s difficult to demonstrate the absolute value of making investments in your talent or talent practices.
However even small improvements in hiring, onboarding, and managing talent can result in significant ROI for the business. In this whitepaper, I’ll walk through a case study that quantifies the return of a handful of People Practices and propose a framework to help you articulate the ROI of People Practices more broadly.
To help assess the business impact of People Practices I would like to introduce and define a new concept: using Employee Lifetime Value (ELTV) to compare the relative return of People Practices.
Defining ELTV
Employee Lifetime Value represents the total net value over time that an employee brings to an organization. The People Team’s job is to drive the organization to maximize ELTV. It can achieve this goal by developing and executing programs that impact the inputs that drive ELTV. When we put these programs into the context of the employee lifetime value, we can more clearly see their relative ROI and their contribution to the business.
This concept is illustrated in the graph below, which presents ELTV in terms of the employee lifecycle. The X axis represents time, spanning from the start date to the day the employee leaves and the Y axis represents employee output.
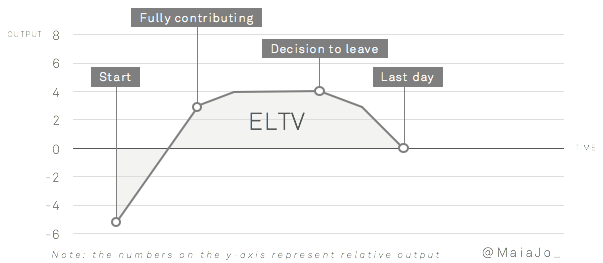
At the “Start,” an employee’s output is negative because they’re not yet doing anything to contribute to the team but they have consumed resources from the recruiting and hiring team.
They then ramp up productivity until reaching the next milestone, “Fully contributing”, where an employee has fully ramped up in their role.
At some point, an employee’s growth plateaus and they start to consider other employment options. They make the “Decision to leave.” Generally after this point their productivity starts to decrease.
Finally, an employee reaches their “Last day” at the company. Their output goes to zero at this point.
The 4 inputs of ELTV
The ELTV of the employee is represented by the gray-shaded area under the curve (the integral, for those who like calculus). The goal is generally to make this area as tall and as wide as possible. Note: This is a simplified version of the curve for illustration purposes. In reality, there are dips and valleys and it’s generally not as linear.
As illustrated, there are four ways to increase ELTV, or maximize the area under the curve:
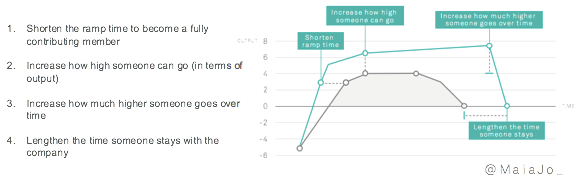
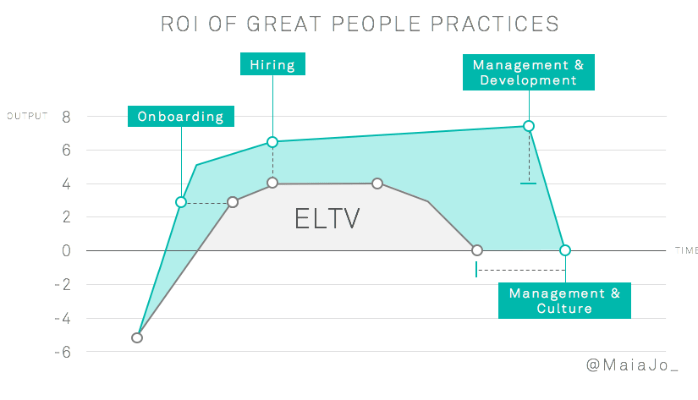
These inputs can be loosely mapped to a handful of strategic People Practices, as presented below. In reality, each of these practices impacts the whole curve, but for the sake of illustrating the impact, I’ve isolated the variables.
Onboarding: A good onboarding program accomplishes two goals:
1) It decreases the time it takes an employee to become a fully contributing member
2) It significantly increases the likelihood that the employee will stay with the company long-term.
Hiring: An excellent hire has a higher maximum output from the beginning, plus has the added network effect of attracting and elevating other top performers.
Management & Development: Excellent management and development practices increase the value an employee brings to the organization over time.
Management & Culture: A strong management practice and positive culture are directly correlated with retention, which results in an increase in ELTV.
Case Study: The impact of People practices on ELTV
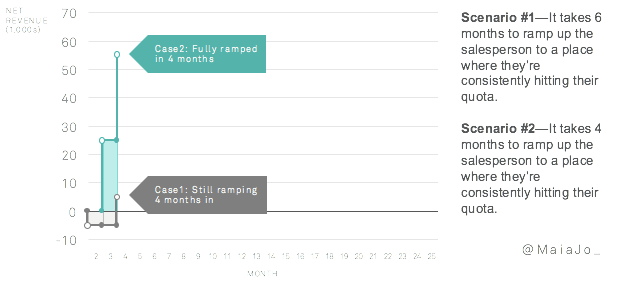
To demonstrate the impact of these inputs, let’s consider two common scenarios. To illustrate how much impact even a small improvement in People Practices can have, I’ll use conservative assumptions for each input. In reality, the differences can actually be much greater.
- Scenario 1: A normal organization with average People Practices
- Scenario 2: An organization with slightly better, more optimized People Practices
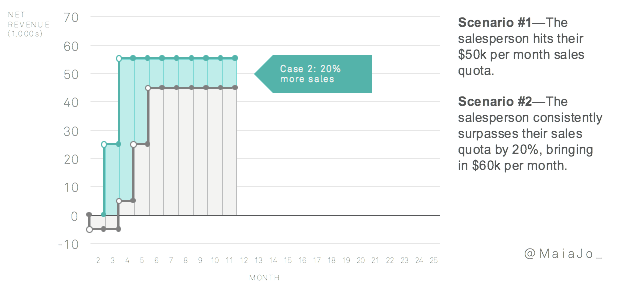
We’ll use salespeople for our scenarios, as their output is more directly measurable than many other roles. Let’s assume that in both Scenario 1 and Scenario 2 the salespeople have salaries of $5,000 per month and quotas of $50,000 per month. Their projected output per month is $50,000 of revenue less their salary of $5,000, resulting in $45,000 net revenue per month.
An important note: For most roles, output will not be easily measured with one number. In those cases, you might perform a similar exercise, but just compare the different scenarios and assess based on relative value. Generally the differences will be compelling enough, even absent precise calculations.
Impact of Onboarding
Conservative assumption: A better onboarding program that encompasses pre-boarding, a deliberate new hire experience, and training can decrease an employee’s ramp time by 30%.
Impact of Talent Acquisition
Conservative assumption: A better hire —which can be achieved by taking a structured and data-driven approach to sourcing, interviewing, screening and closing—can outperform a peer by 20%.
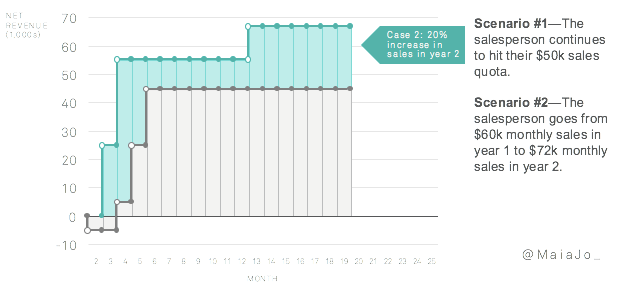
Impact of management & development
Conservative assumption: Great management and development practices that involve coaching and training can improve an employee’s performance by 20% in a year.
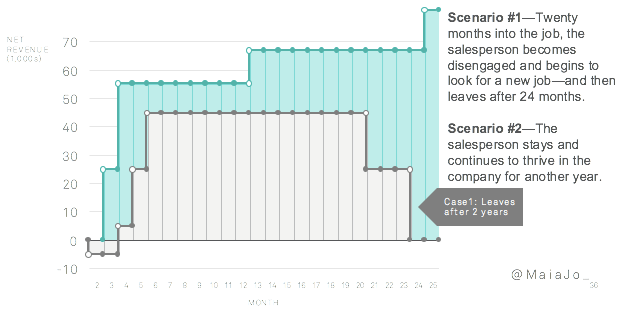
Impact of culture & management
Conservative assumption: Great culture and management practices can add a year to employee tenure.
The million-dollar revelation
If we continue the graph out over three years and assume that it takes 4 months to backfill the salesperson in scenario 1, the relative difference in ELTV becomes staggering. In the case study we walked through, the difference between average and slightly optimized People Practices for one salesperson over the course of three years is $1,300,000 in net revenue, or a 2.5x difference for the organization.
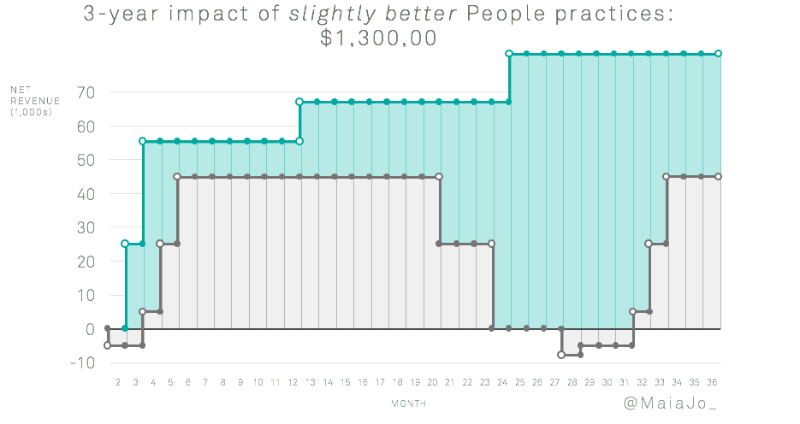
n this case study, the difference between average and slightly optimized People Practices for one salesperson over the course of three years is $1,300,000 in net revenue, or a 2.5x difference for the organization.
Applying ELTV to roles with less measurable outputs
The output of a salesperson is easy to measure. It becomes a lot harder to articulate the output of other roles that have less quantifiable impacts. However, the relative difference in ELTV between average versus great People Practices is so dramatic that simply comparing two scenarios can give you enough information to assess the ROI of a particular initiative.

We can apply ELTV to Engineering, but instead of “net revenue” on the Y-axis, let’s use an abstract concept of “engineering productivity”. In the sales case study, I assumed a 20% difference between the two salespeople. In engineering, I’ve heard some people say that a great engineer is 10xas good as an average engineer. For the sake of sticking with conservative assumptions, we’ll assume that difference in engineer #1 and engineer #2 is 3x.
The ELTV difference between these two engineering examples is 6.6x over three years. Put another way, that means that one engineer in scenario 2 can do the work of 6 engineers in scenario 1. That’s a staggering return on investment from a handful of People programs.
What this model isn’t trying to say
I’m really excited about this concept. And there’s one part of it that I hate. I hate that it implies that people are a number (i.e., their ELTV). For my entire career, I’ve prioritized building awesome teams and cultivating the best work environment I can. For me, investing in people, their development, and the way we all work together is the end goal. I want my team to grow, develop, make an impact, and have fun at work. If I had unlimited resources, I’d throw most of them into my people. BUT, unlimited resources is not the reality of most businesses. As an executive, I have to make hard choices about where to invest. And so I developed the ELTV model as a framework to help me justify and articulate all of the investments I think should be made in people. I sincerely hope that businesses use this framework in that lens, and realize that investing in your talent isn’t just the right thing to do, it’s the smart thing to do. Life is better when work is more engaging, more rewarding, and more fun, and it just so happens that we can make a case for that philosophy from an ROI perspective too.
Summing it up
- Use ELTV to assess the ROI of People Practices.
- ELTV inputs: hiring, onboarding, management, development, & culture
- When it’s not possible to calculate precise values, defer to comparing relative output. The differences are so significant that the ROI will be fairly obvious.
- Even small improvements in the inputs can have a dramatic impact on ELTV. In one of the case studies above, we saw a 6x difference in the ELTV of one employee over 3 years.
Appendix: Supporting data
- Google began onboarding new hires using a short checklist sent to managers the week before the new hire started. The result was 25% less time to get to full productivity (one month). (Work Rules, Laszlo Bock, p.295)
- Organizations with a strong onboarding process improve new hire retention by 82% and productivity by over 70%. (The true cost of a bad hire, Brandon Hall)
- Recruiting is the HR function with the highest impact on revenue. Excellent recruiting practices contribute to more than 3x revenue growth and 2x profit margins. (Realizing the value of people management, BCG)
- Companies that hire managers based on their management skills saw a 48% increase in profitability. (State of the American Manager, Gallup)
- 67% of Millennials believe it is management’s job to provide accelerated development opportunities to encourage them to stay. (Why and How People Change Jobs, LinkedIn)
- 1 in 2 employees left a job because of their manager, according to a survey measuring the engagement of 27 million employees. (State of the American Manager, Gallup)
- 36% of people switching jobs left because they were “unsatisfied with the work environment / culture” of their previous employer. (Why and How People Change Jobs, LinkedIn)
